
Introducing Aerial View
A revolutionary AI-powered trade surveillance solution
AI Transformation
Converts raw violation data into actionable intelligence using cutting-edge AI tools unavailable just three years ago.
Primary Display
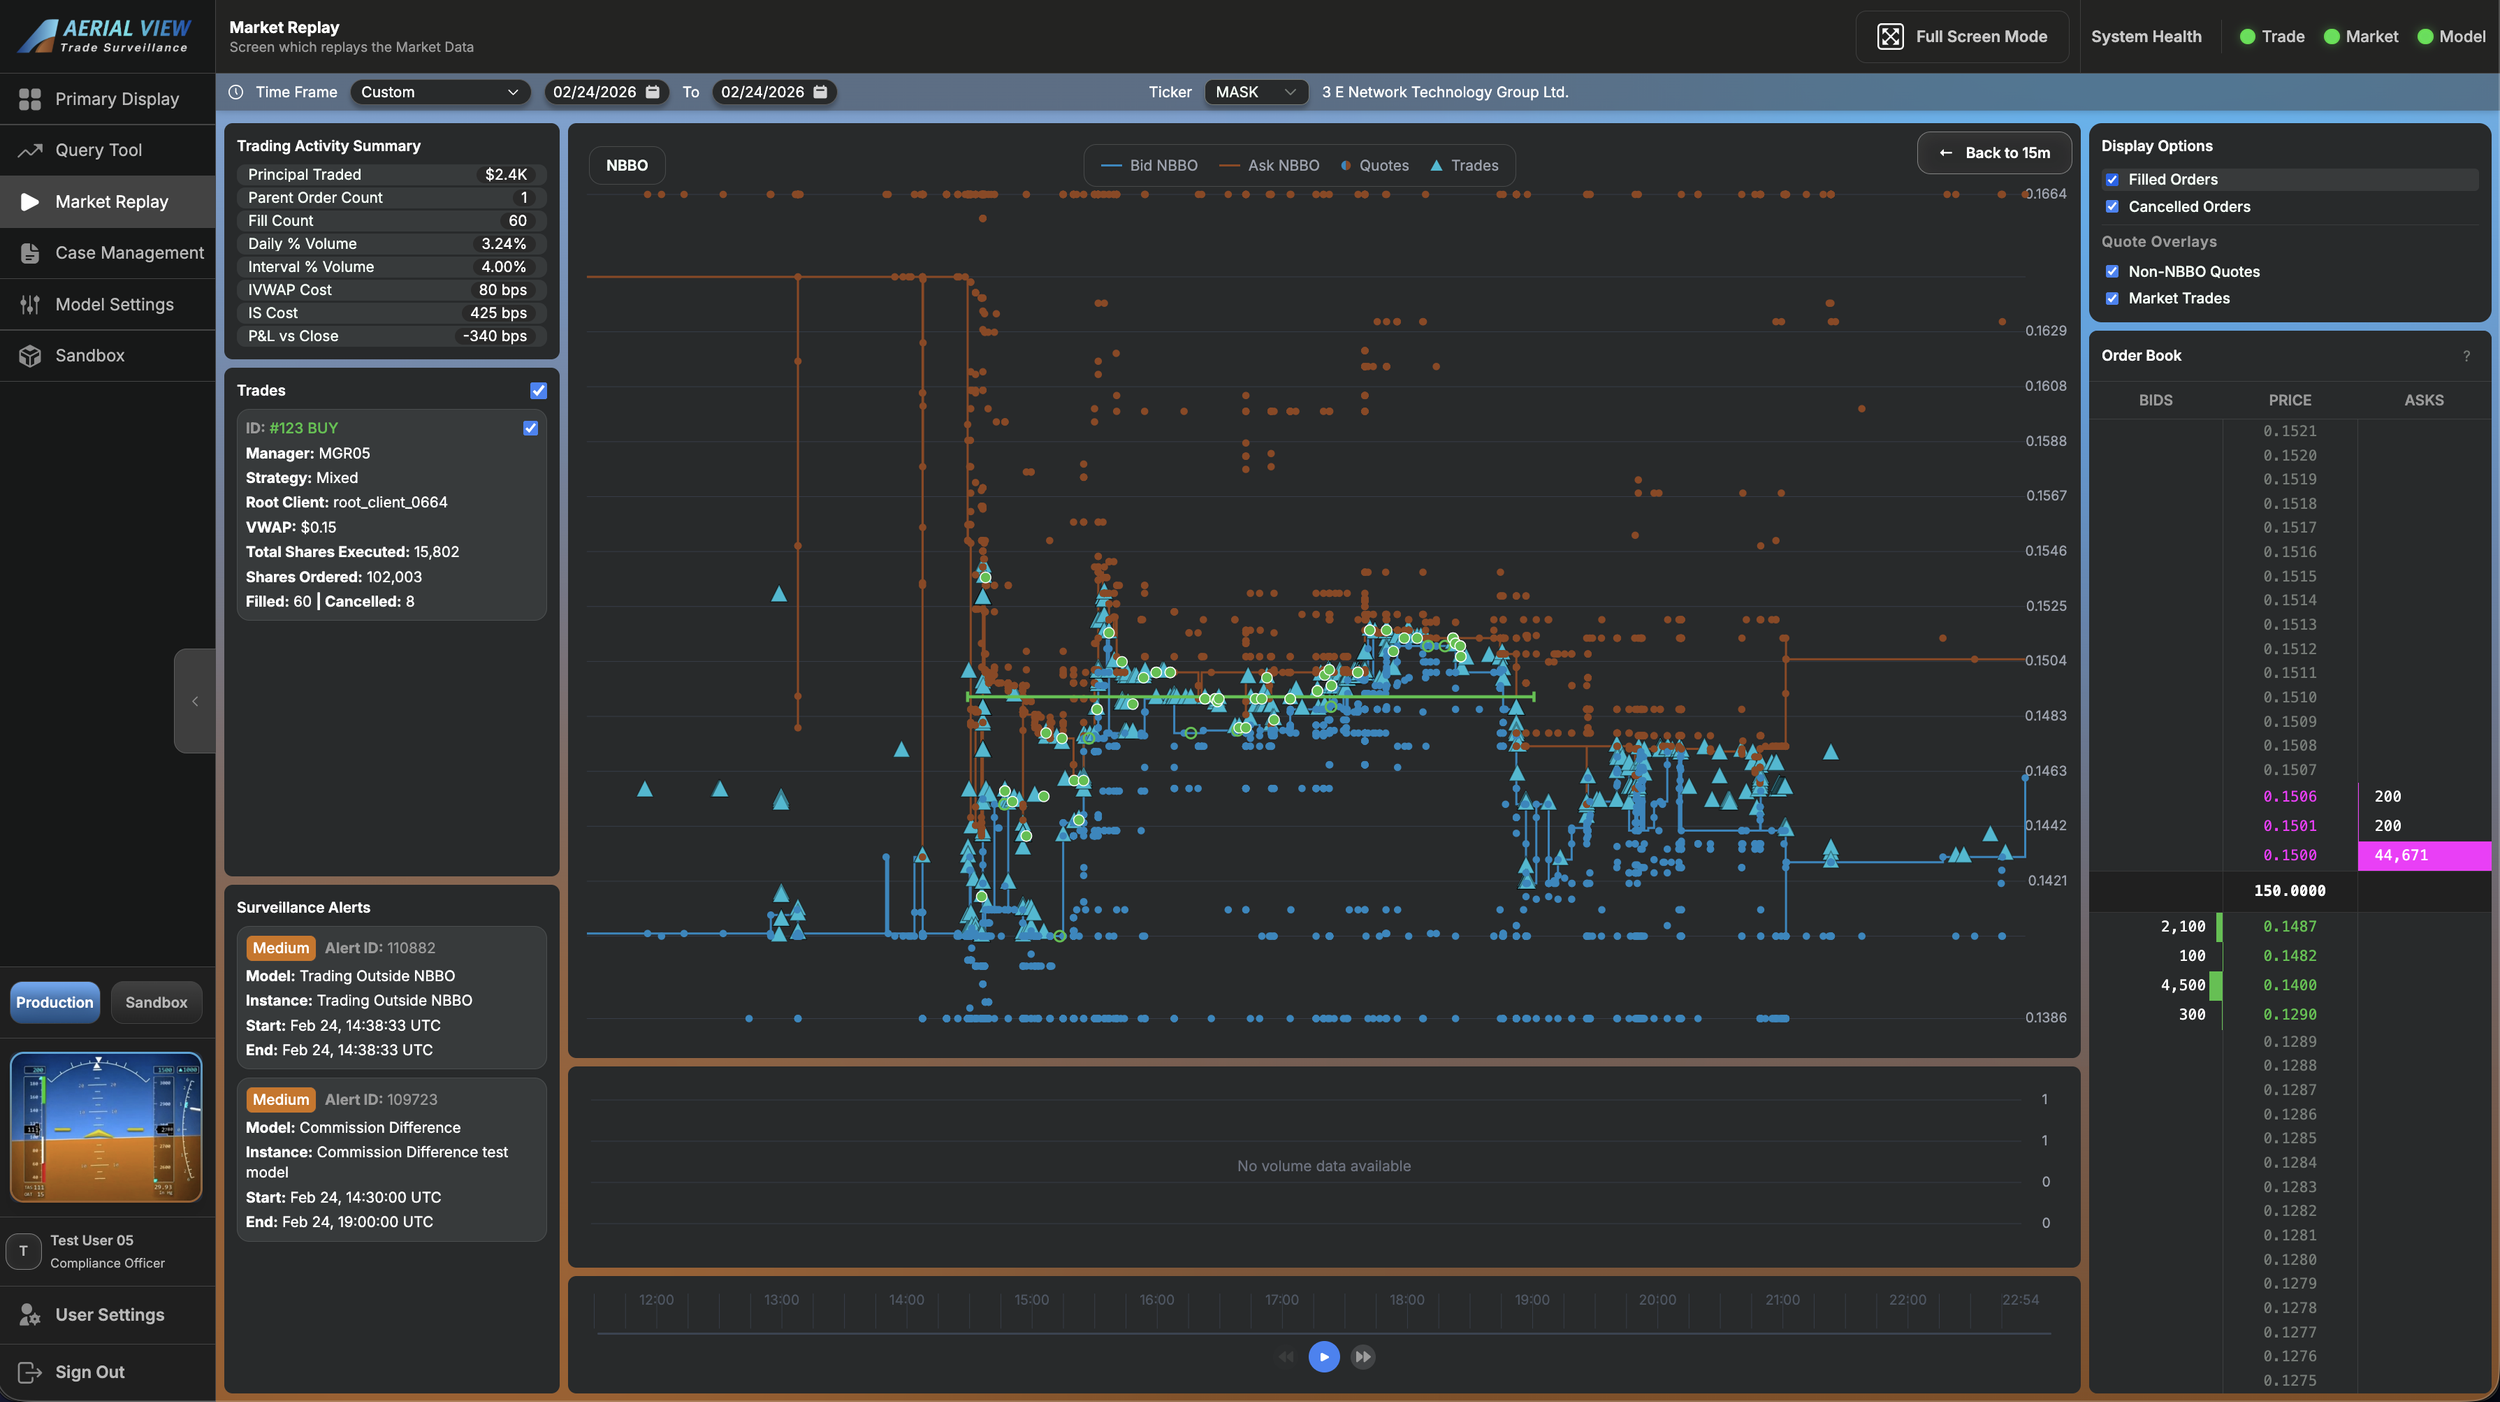
An aviation industry-inspired interface that displays all critical information on one screen, eliminating the need for multiple tabs.
Full Configurability
Unprecedented control over surveillance model tuning and display preferences for every end user.

Unparalleled Visibility and Control
We're dedicated to empowering our clients with visibility and insight, streamlining investigation processes, and driving business growth.
For Compliance Officers
Optimize investigation processes with AI-driven insights and expert summaries
Customize surveillance models to meet specific regulatory requirements
Benefit from expert-calibrated settings for optimal performance
For Portfolio Managers
Gain visibility into potential regulatory risks associated with trades
Make informed decisions with access to critical trade data and analytics
For Head Traders
Identify and mitigate potential risks, reducing the likelihood of costly regulatory issues and reputational damage
Streamline trading strategies, minimize regulatory disruptions, and maximize returns while staying compliant
For C-Suite Executives
Drive business growth with enhanced compliance processes
Leverage industry expertise and best practices for optimal results
Surveillance Models Include:
Marking the Close Auction
Marking the Open
Marking the Open Auction
Mini Manipulation
Momentum Ignition
OFAC Compliance
Order Book Dominance
Pinging
Pre-Arranged Trading
Ramping
Spoofing
Spoofing – Away Account
Sub-Penny Quoting
Trade Halt
Trade Concentration – Full Day
Trade Concentration – Intraday
Trade Through
Trading Outside of NBBO
Wash Trades
Watch List
Window Dressing
Zero Commission
Abnormal Messaging
Abnormal Order
Abusive Messaging
AML Red Flag - Illiquid Securities
AML Red Flag - Low Priced Securities
Capping and Pegging
Collusive Spoofing
Commission Difference
Cross Trade
Flickering
Front Running
High Commission
Insider Trading – News
Insider Trading – Price
Invalid Symbol
IPO – Market Order
IPO – Price Away
Layering
Limit up/limit down (LULD)
Looping
Low Volume Large Order
Marking the Close

Aerial View Experience
Everything you need in a surveillance tool
Advanced surveillance for all types of abusive or illegal trading practices, such as spoofing, ramping, and insider trading
Treasury and municipal bond monitoring with commission tracking and regulatory compliance verification
Derivatives surveillance ensuring compliance across complex trading strategies and market manipulation detection
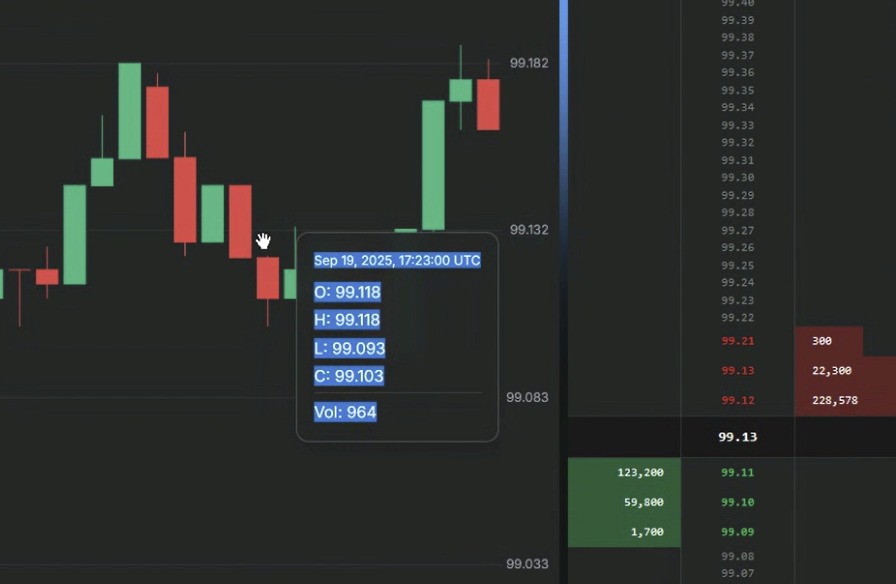
Proprietary Market Replay and Sandbox functionality
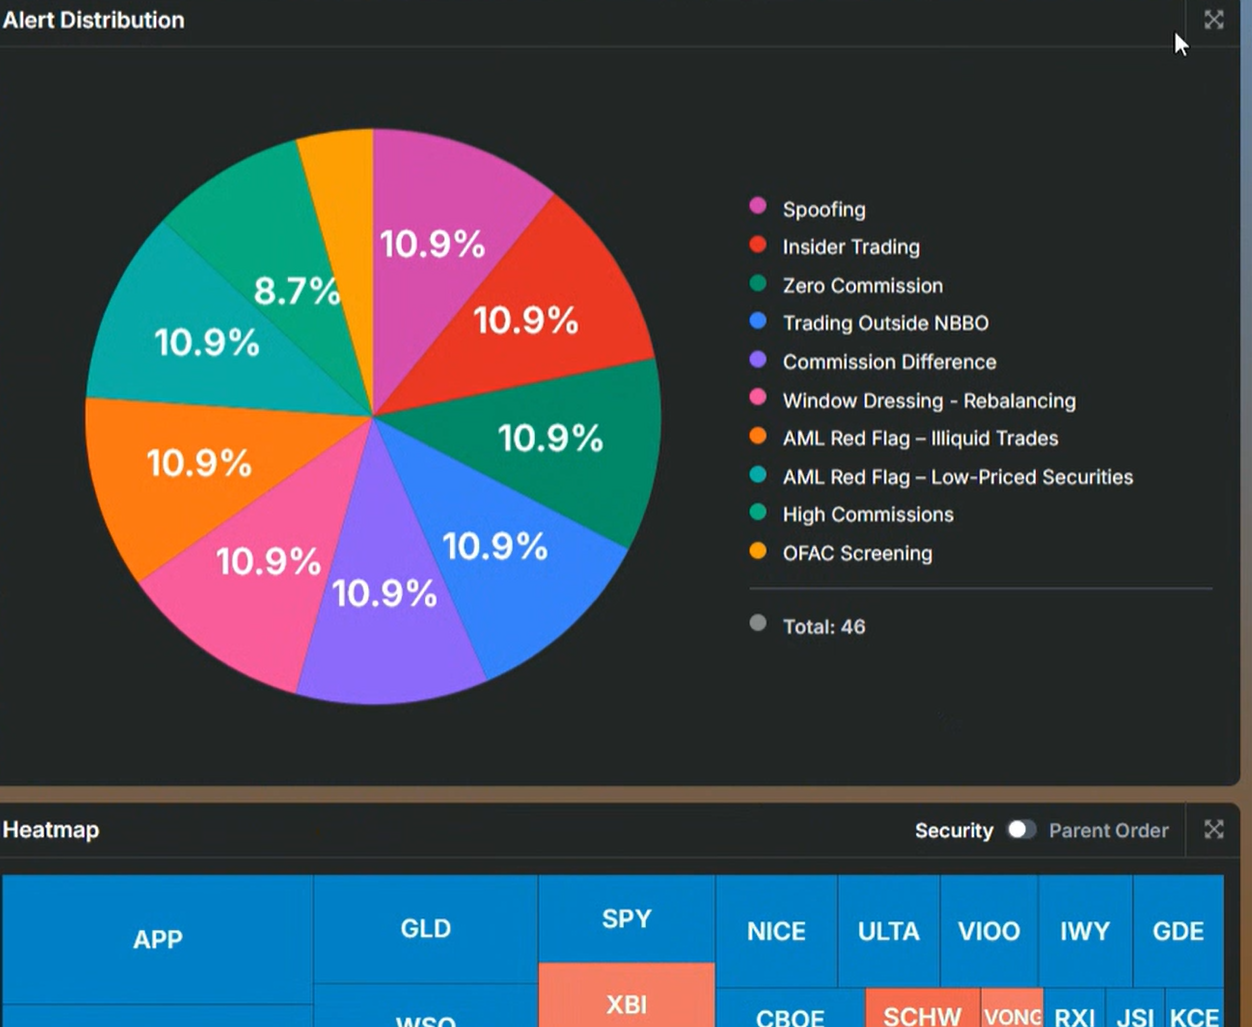
220 potential equity violations, 150 high priority
Our platform offers everything a traditional surveillance tool offers, and plenty more.
.


Core Architecture Components
Aerial View's architecture consists of four primary components working seamlessly together to deliver unprecedented surveillance capabilities and user experience in regulatory compliance.
-
Generational leap in trade surveillance data presentation using extensive AI-generated content and unparalleled performance capabilities.
-
100+ models based on global regulations using machine learning and AI to scan client trading activity for prohibited behavior.
-
Platform accepts trade data from clients and exchanges across all asset classes, validating and transforming it into common structure.
-
Comprehensive indicative and intraday pricing for securities across all asset classes supporting accurate analysis.
Value Producing
AI-Generated Executive Summary
Granular event, alert, tolerance, and threshold data is auto-generated as if you had an expert analyst create a succinct executive summary with all needed details.
Unique Surveillance Tools
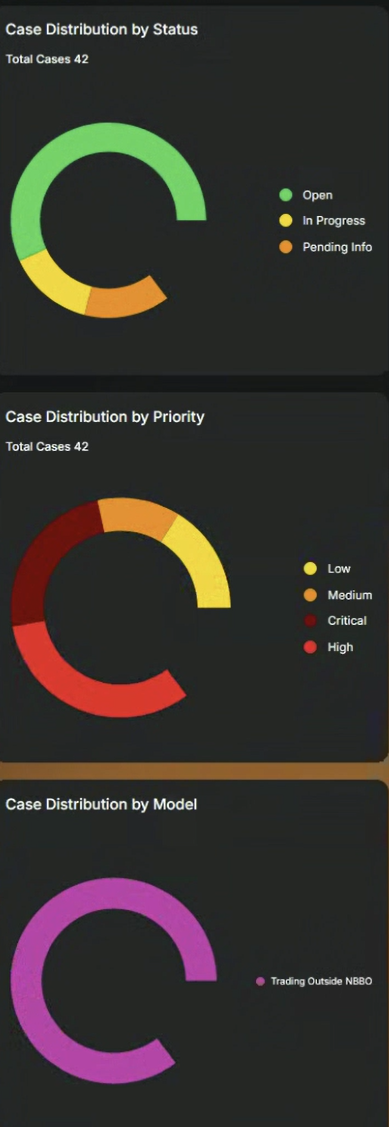
The platform includes essential tools like market replay, trade data viewer, case management, and sandbox environments for fine-tuning surveillance parameters.
Expert Calibration & Insight
Surveillance models arrive pre-configured with parameters derived from years of industry experience, providing immediate value.
Why the name Aerial View?
Our goal is to empower firms to navigate the complexities of modern financial markets with confidence. Aerial View’s innovative Primary Flight Display-inspired UI can provide, on a single screen, every regulatory risk a compliance officer, trader, or company executive might need to know about.
This is the future of trade surveillance
Discover how Aerial View can transform your trade surveillance capabilities. Contact us today to schedule a demo and learn more about our innovative platform.